Streamable HTTP transport
When I recently study MCP, I come to know a new concept called “Streamable HTTP”. This is the transport used by MCP when the client and server are on different machines. It allows both client and server to be able to initiate communication at any time. When I learned this, I had a thought why MCP invented a new transport like this, instead of using WebSocket.
As my research goes deeper, I understand Streamable HTTP is not a new invention by MCP, and it solves different problems and work in a different pattern with WebSocket.
The make of Streamable HTTP
Streamable HTTP really is a terminology created by MCP. It supersedes the old HTTP+SSE transport introduced in November 2024, when MCP as a protocol was initially drafted. Actually, HTTP+SSE is a good explanation of Streamable HTTP. To understand this, let’s understand SSE first.
SSE (Server-sent Event)
is a web standard introduced in 2000s. Originally, this standard is designed to push updates from the server. For example, assuming a forum can automatically add new post to its homepage without requiring the user to manually refresh the page. This can be done via SSE. Once the client initiates a SSE request, the client and the server establish a long-lived connection, until the connection is closed. During the lifespan of the connection, the server is able to push data to the client via text/event-stream content type.
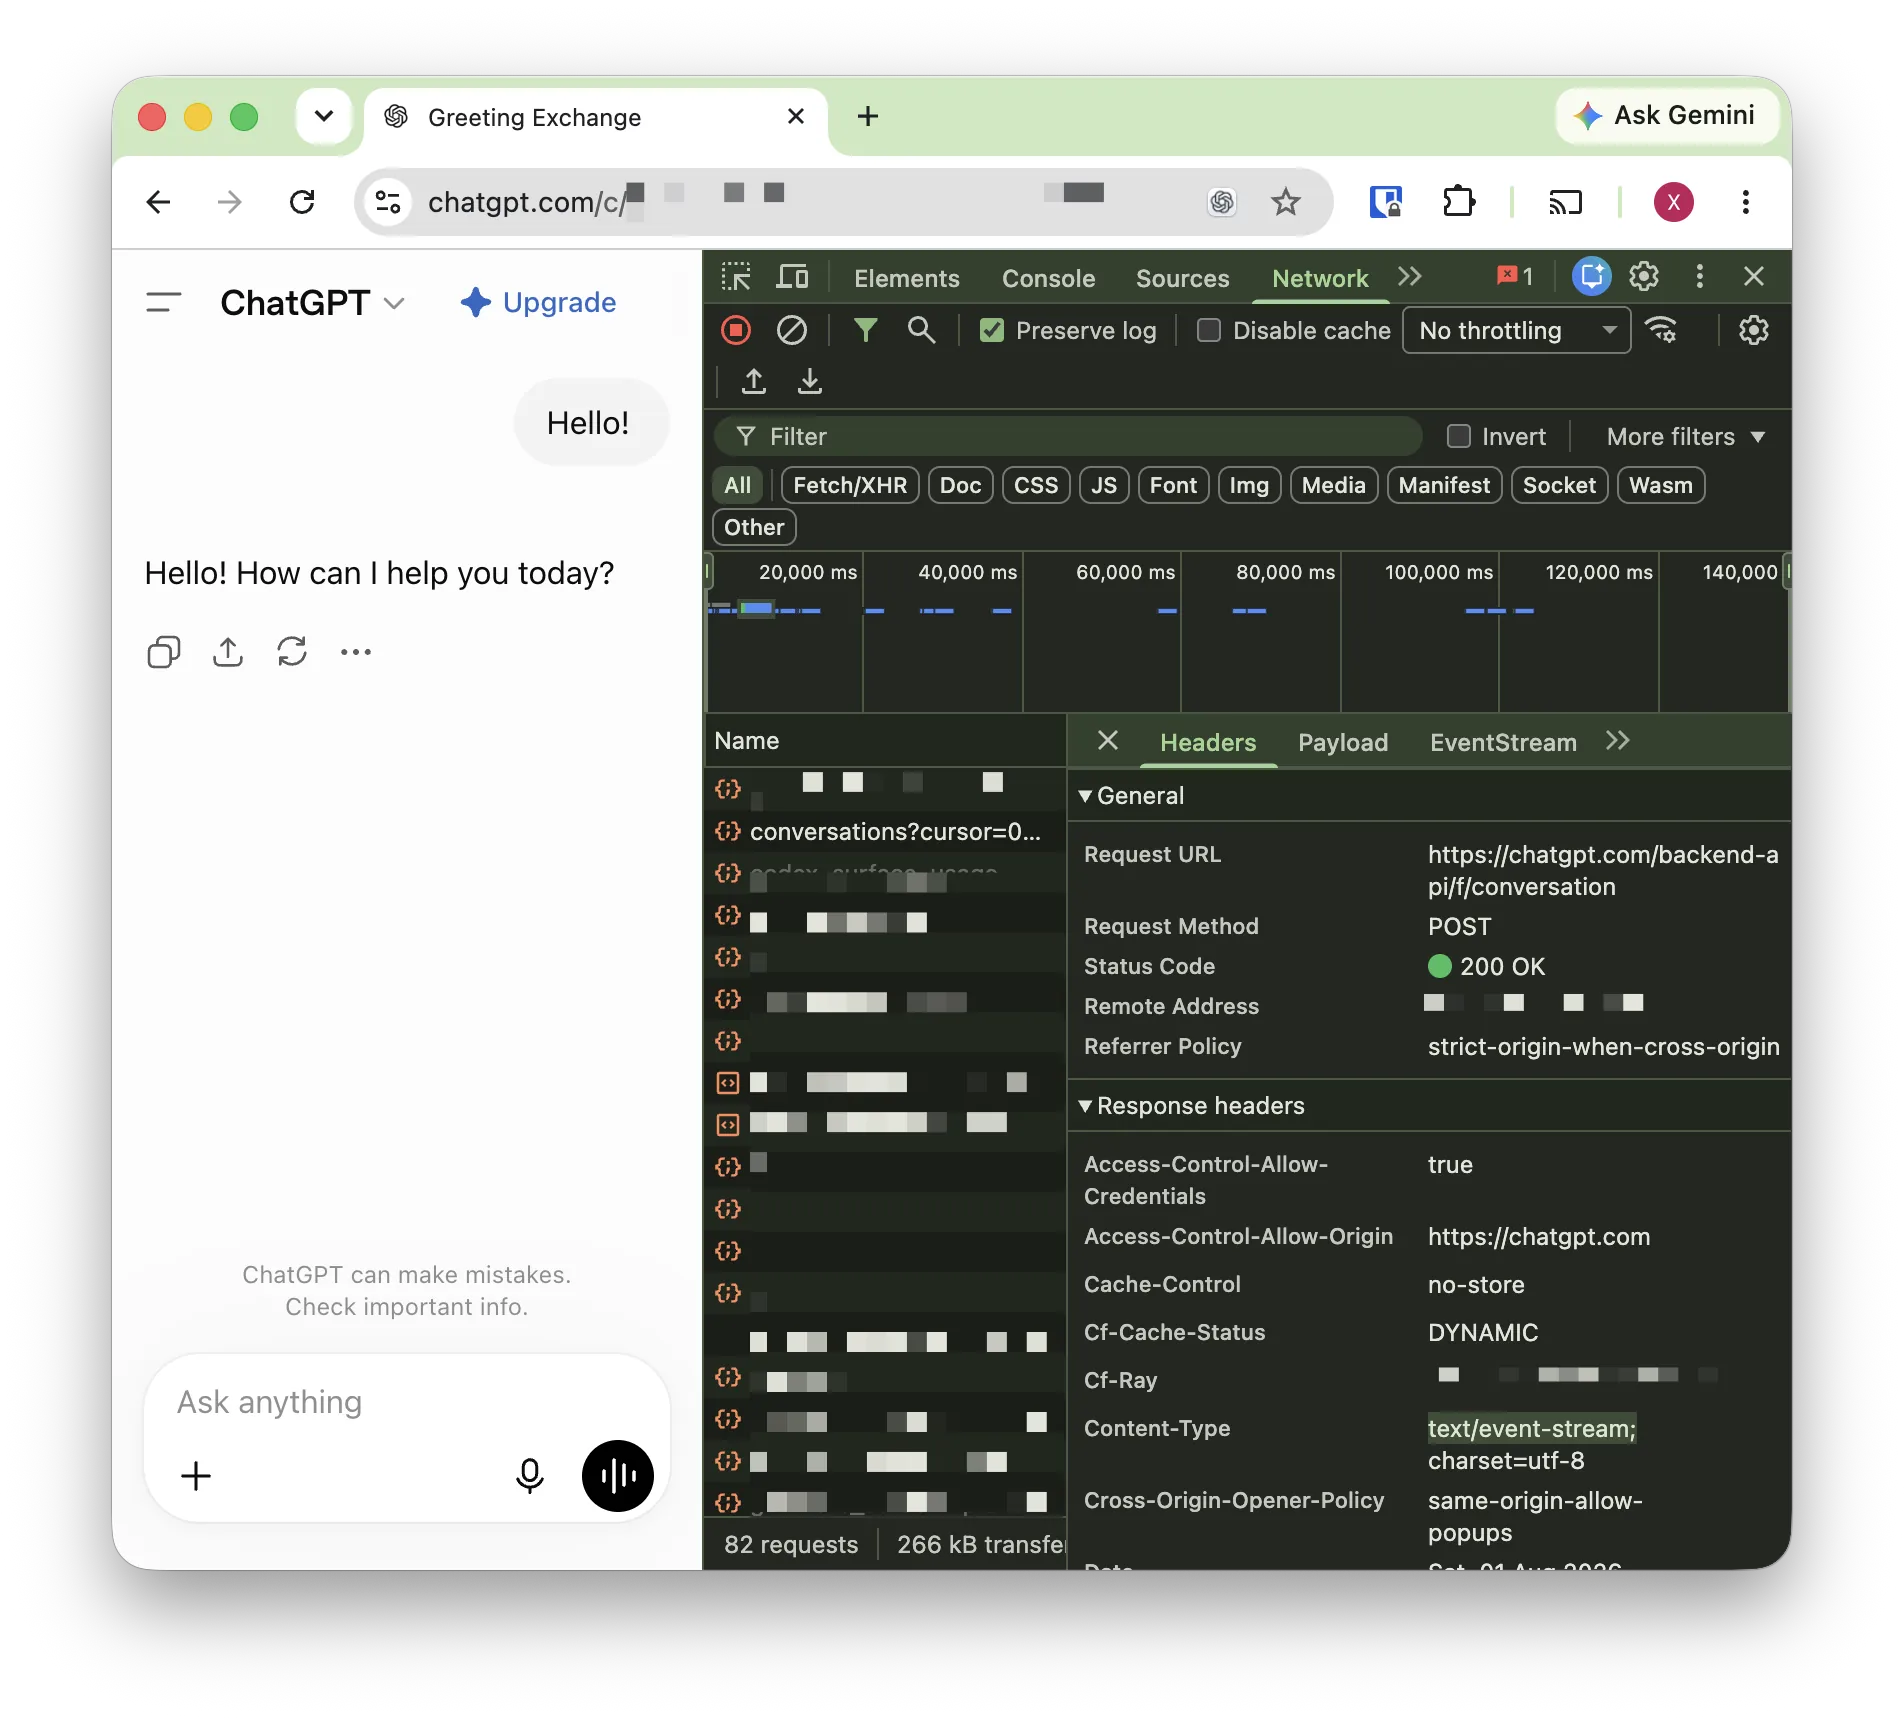
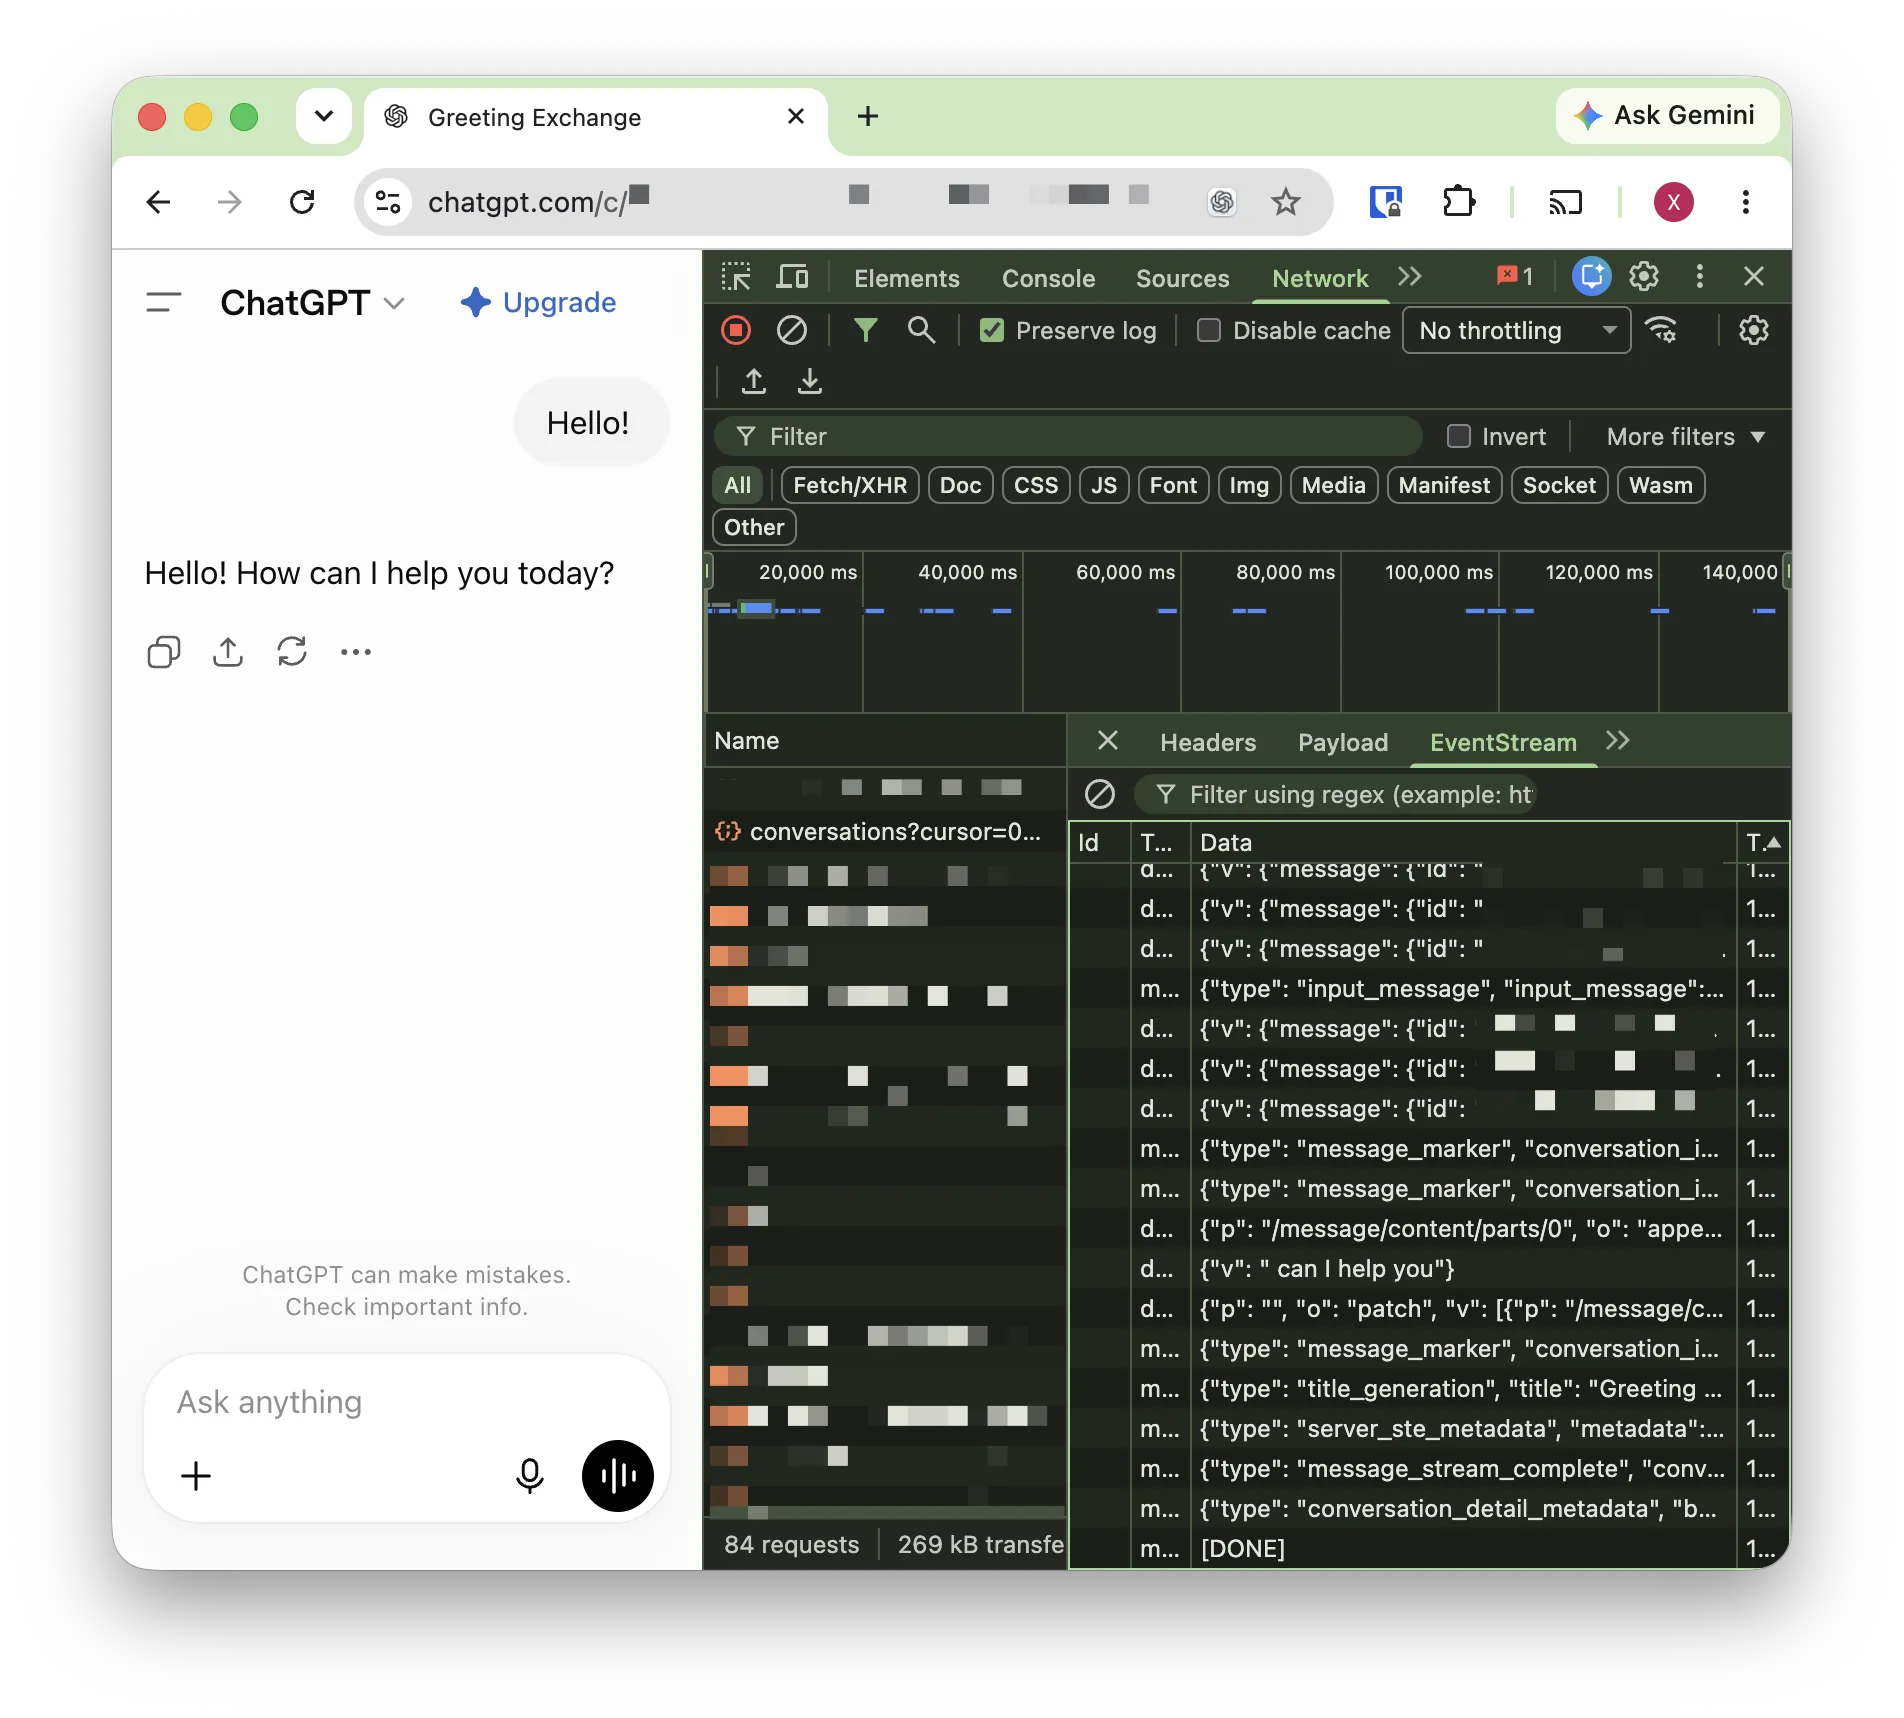
A real life use case is the AI chat app. For example, when we talk to ChatGPT, the ChatGPT API doesn’t send the response back in a plain JSON all in once. Instead, the browser initiates a SSE channel, and the server pushes response as chunks in a streaming fashion.
MCP makes use of SSE, allowing the MCP client to establish SSE channels, so that MCP server is able to push logs and progress updates back to the client.
In the context of MCP, SSE is only used for log and progress updates, and it is optional. The tool call result is not streamed via SSE. The tool call result is always atomic.
How is SSE different from WebSocket
To understand the difference, let’s also briefly explain how WebSocket works. To initiate a WebSocket connection, the client needs to send a normal HTTP request with an Upgrade: websocket header. The server responds and then they switch protocol in the following communication. From that point, the connection is not via HTTP protocol anymore. It is WebSocket protocol.
SSE and WebSocket are different in multiple ways. Here is a quick comparison:
| Aspect | SSE | WebSocket |
|---|---|---|
| Protocol | HTTP | WebSocket |
| Who can send data | Server | Client and server |
| Who can close the connection | Client and server | Client and server |
| What data can be sent | Text | Text and binary |
| Reconnection | Automatic | Manual |
| Enterprise firewall | No problem (standard HTTP) | Doesn’t always work |
Why does MCP choose SSE over WebSocket
In the context of MCP, SSE is used to deliver log and progress updates. The flow is like this:
- MCP client calls
GET /mcpwithAccept: text/event-streamheader; - MCP server responds and establishes a long-lived SSE channel, and responds a session ID;
- When MCP client needs to a call a remote tool, it calls
POST /mcp/messagewith the session ID; - MCP server processes the request and sends the log and progress updates via the established SSE channel, and send the final tool call result back via HTTP response.
Since the log and progress update are optional, if the server is configured to be stateless (no session ID) and send only JSON response (no event streaming), then there is no step 1 and 2, and no session ID in step 3. The remote tool call process still works, but there is just no log and progress bar visible to the client.
I personally feel both SSE and WebSocket work for this scenario. If WebSocket is chosen, when the client initiates the connection with the server, the connection will be upgraded to WebSocket immediately, and then the connection will possibly never be closed, until the chat session is finished. That means every tool call is not another HTTP request, but a WebSocket message. If SSE is chosen, then every tool call is still a standard HTTP request, but in the same time, there is still opt-in server updates capability.
I checked multiple sources for the design purpose of SSE over WebSocket in the context of MCP. I haven’t found a convincing reason for myself, but the reasons I have encountered so far are:
- Even though SSE establishes long-lived connection, thanks to its automatic reconnection, the horizontal scaling is better than WebSocket;
- Corporate network supports SSE better than WebSocket because SSE is standard HTTP;
- SSE still has the native support for Bearer authentication header;
- Everything on WebSocket is sent over the same URL. No URI, no status code. This is potentially complex for observability and architectural design. A lot of engineering scaffold might be required to establish standard.
Perhaps the fourth point is really the reason that MCP chooses SSE. In general, I also think this makes sense. I wouldn’t imagine that we need to constantly revoke a remote tool all the time in a conversation. Because of that, resending the HTTP header for every tool call doesn’t seem to be a big issue. Choosing HTTP sounds more practical in this use case.
Update on 2026/08/01
Right after I posted this article, I went back and reviewed the Streamable HTTP page that I referenced earlier because I noticed some updates were made on July 28 (4 days ago). After reading the updated version, I realised that I need to make an important amendment to reflect the up-to-date specification.
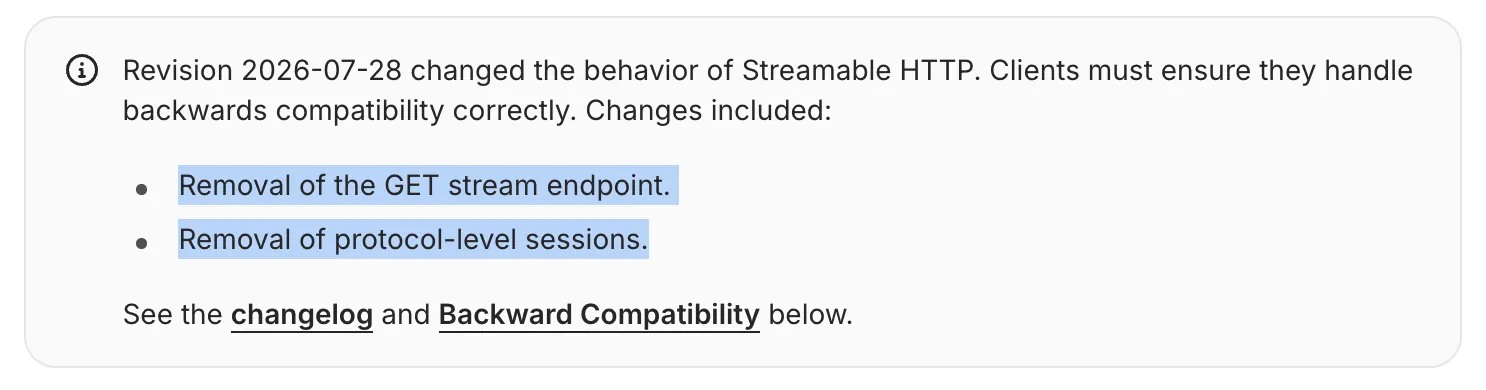
In general, the flow to get SSE channel is changed. Now every tool call request is independent. Session ID and GET /mcp is dropped. All MCP calls are consolidated into POST /mcp. Now the tool call flow looks like this:
- MCP client calls
POST /mcpwithAccept: application/json, text/event-streamheader; - MCP server decides whether a SSE channel should be established according to its configuration;
- In case MCP server decides to set up SSE, then a SSE channel will be established, and its lifespan is scoped to this POST request only;
- The final data sent by the MCP server is the JSON response of the tool call result, and the SSE channel is closed;
- If the MCP server decides to return in pure JSON, then the tool call result is just sent as HTTP response. No intermediate SSE data is sent.
To make a new tool call, the previous steps repeat. During this process, there is no session ID, no persistent SSE channel.
This changes further improves the horizontal scaling situation since the client doesn’t have to keep a long-lived connection with one particular server across different HTTP requests.